- VISION :
- MISSION : To mould students into rational thinkers, competent workers and socially aware citizens

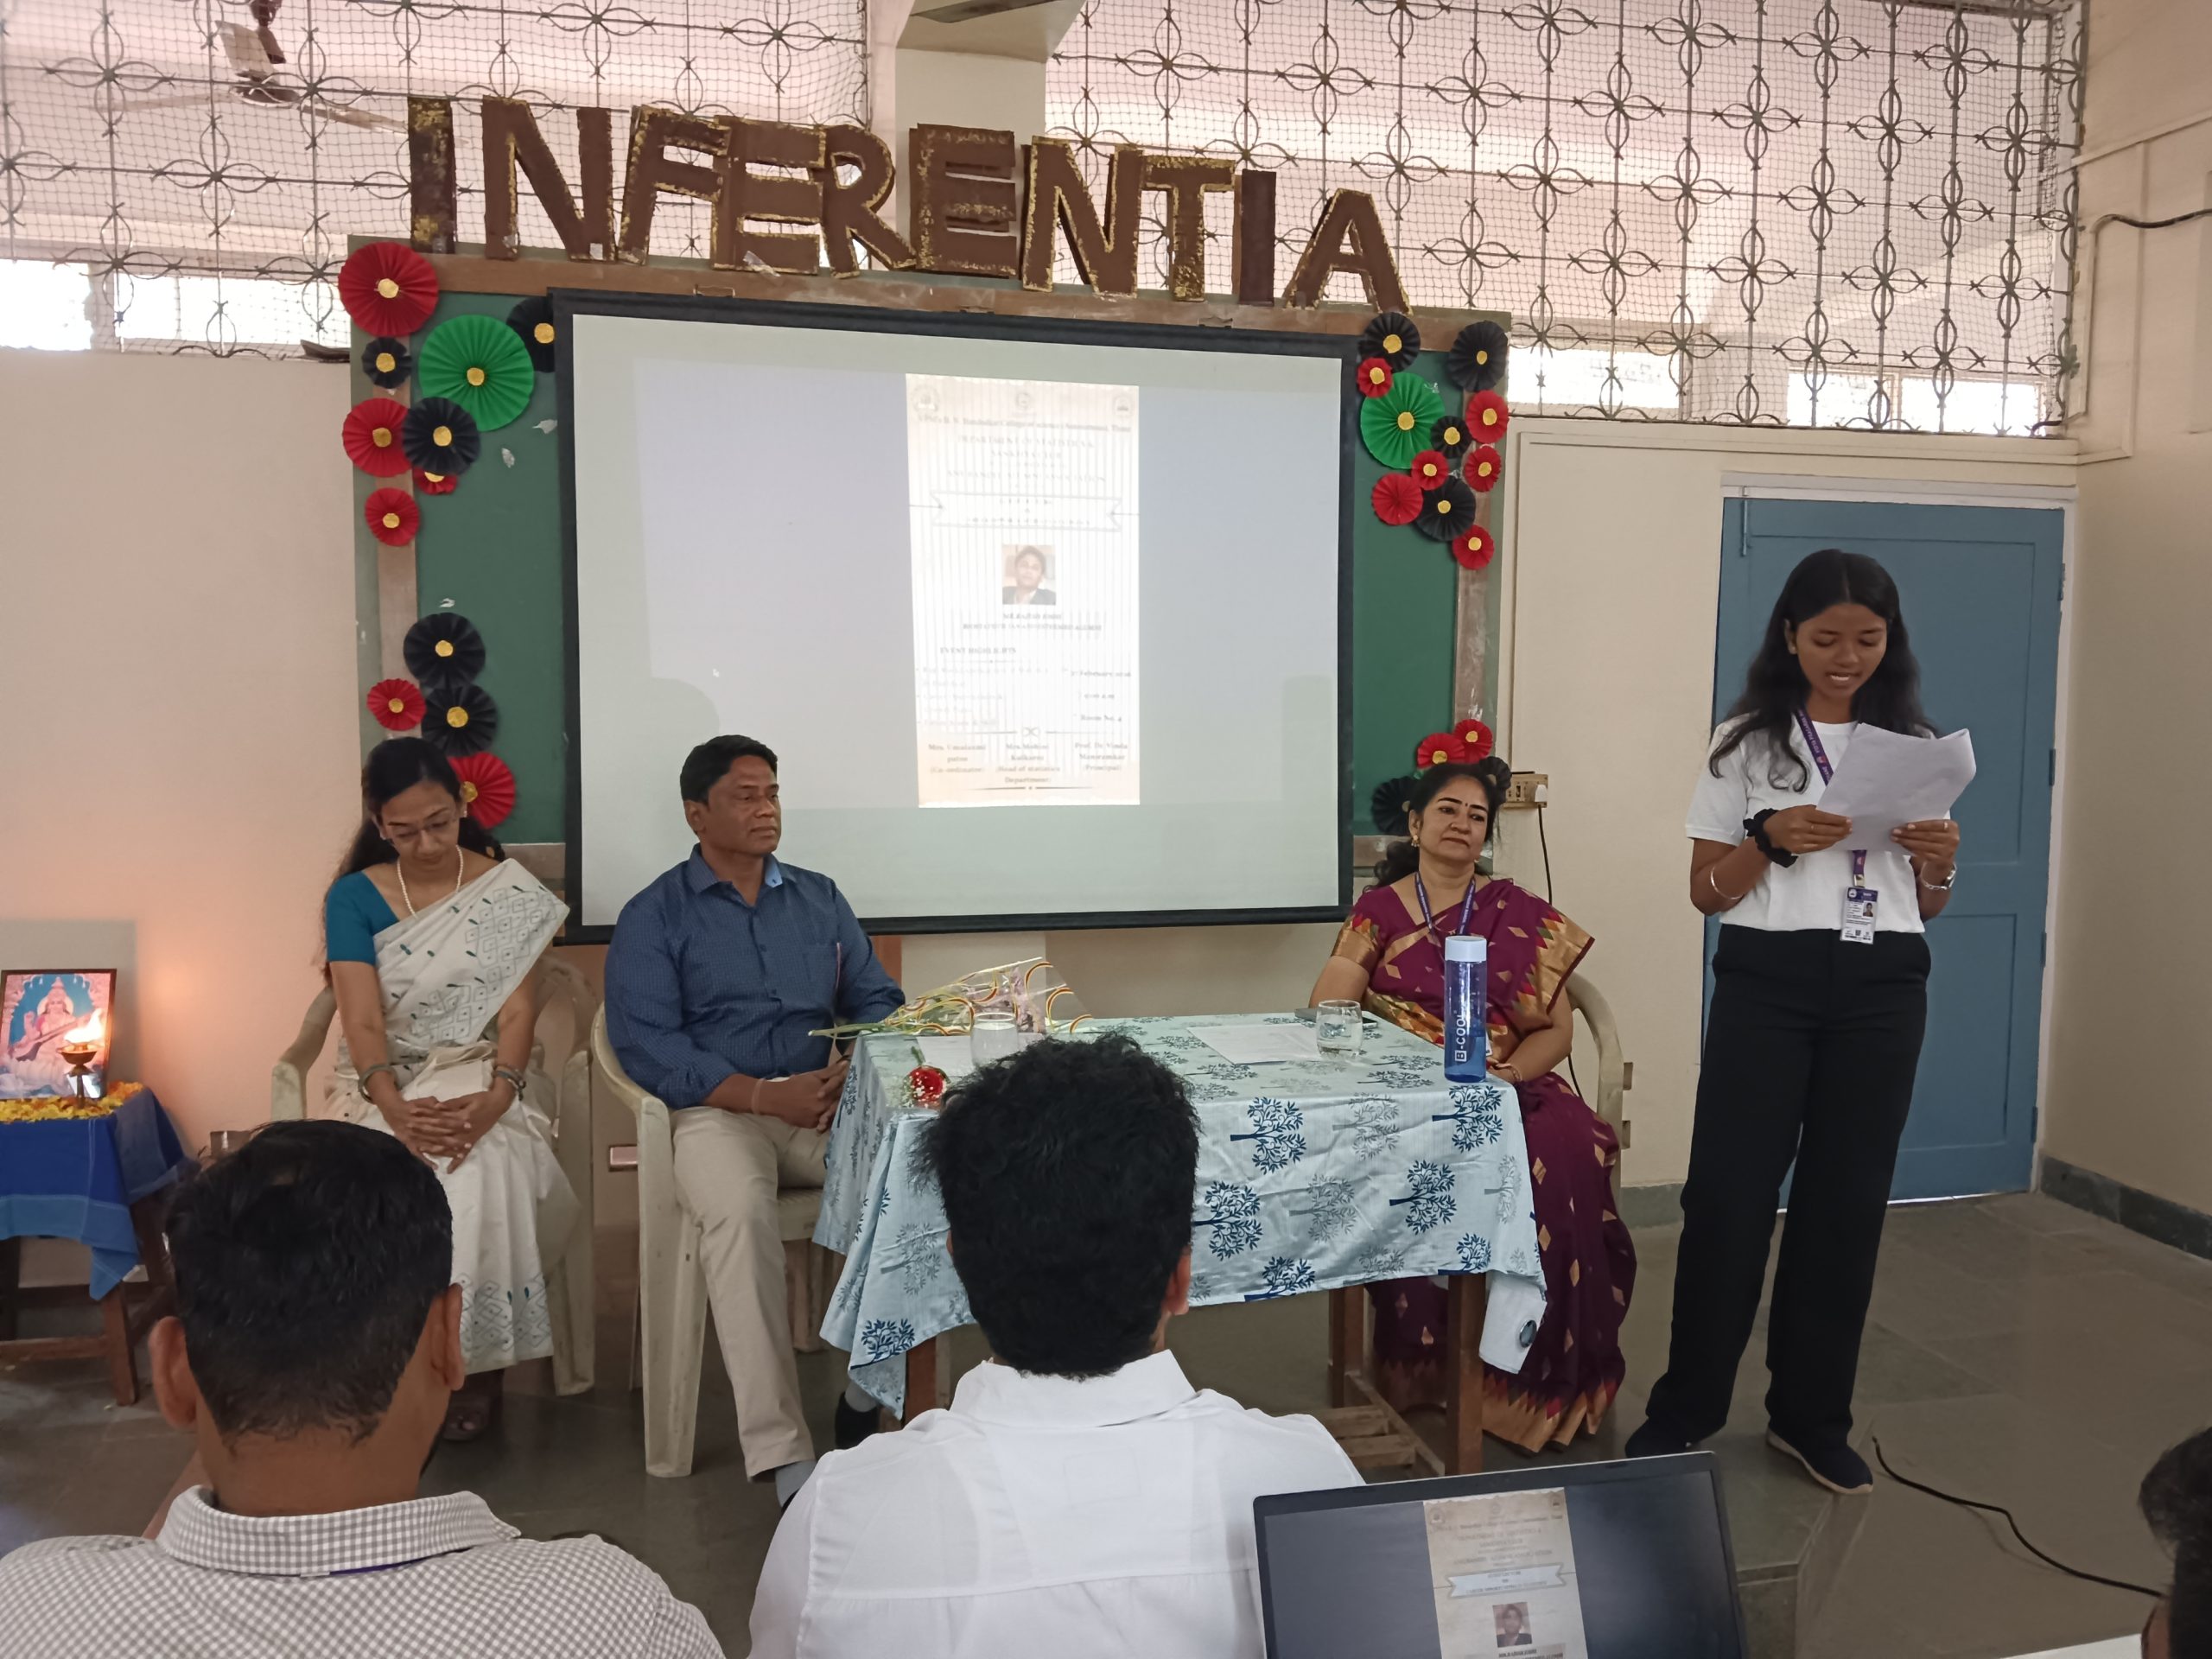
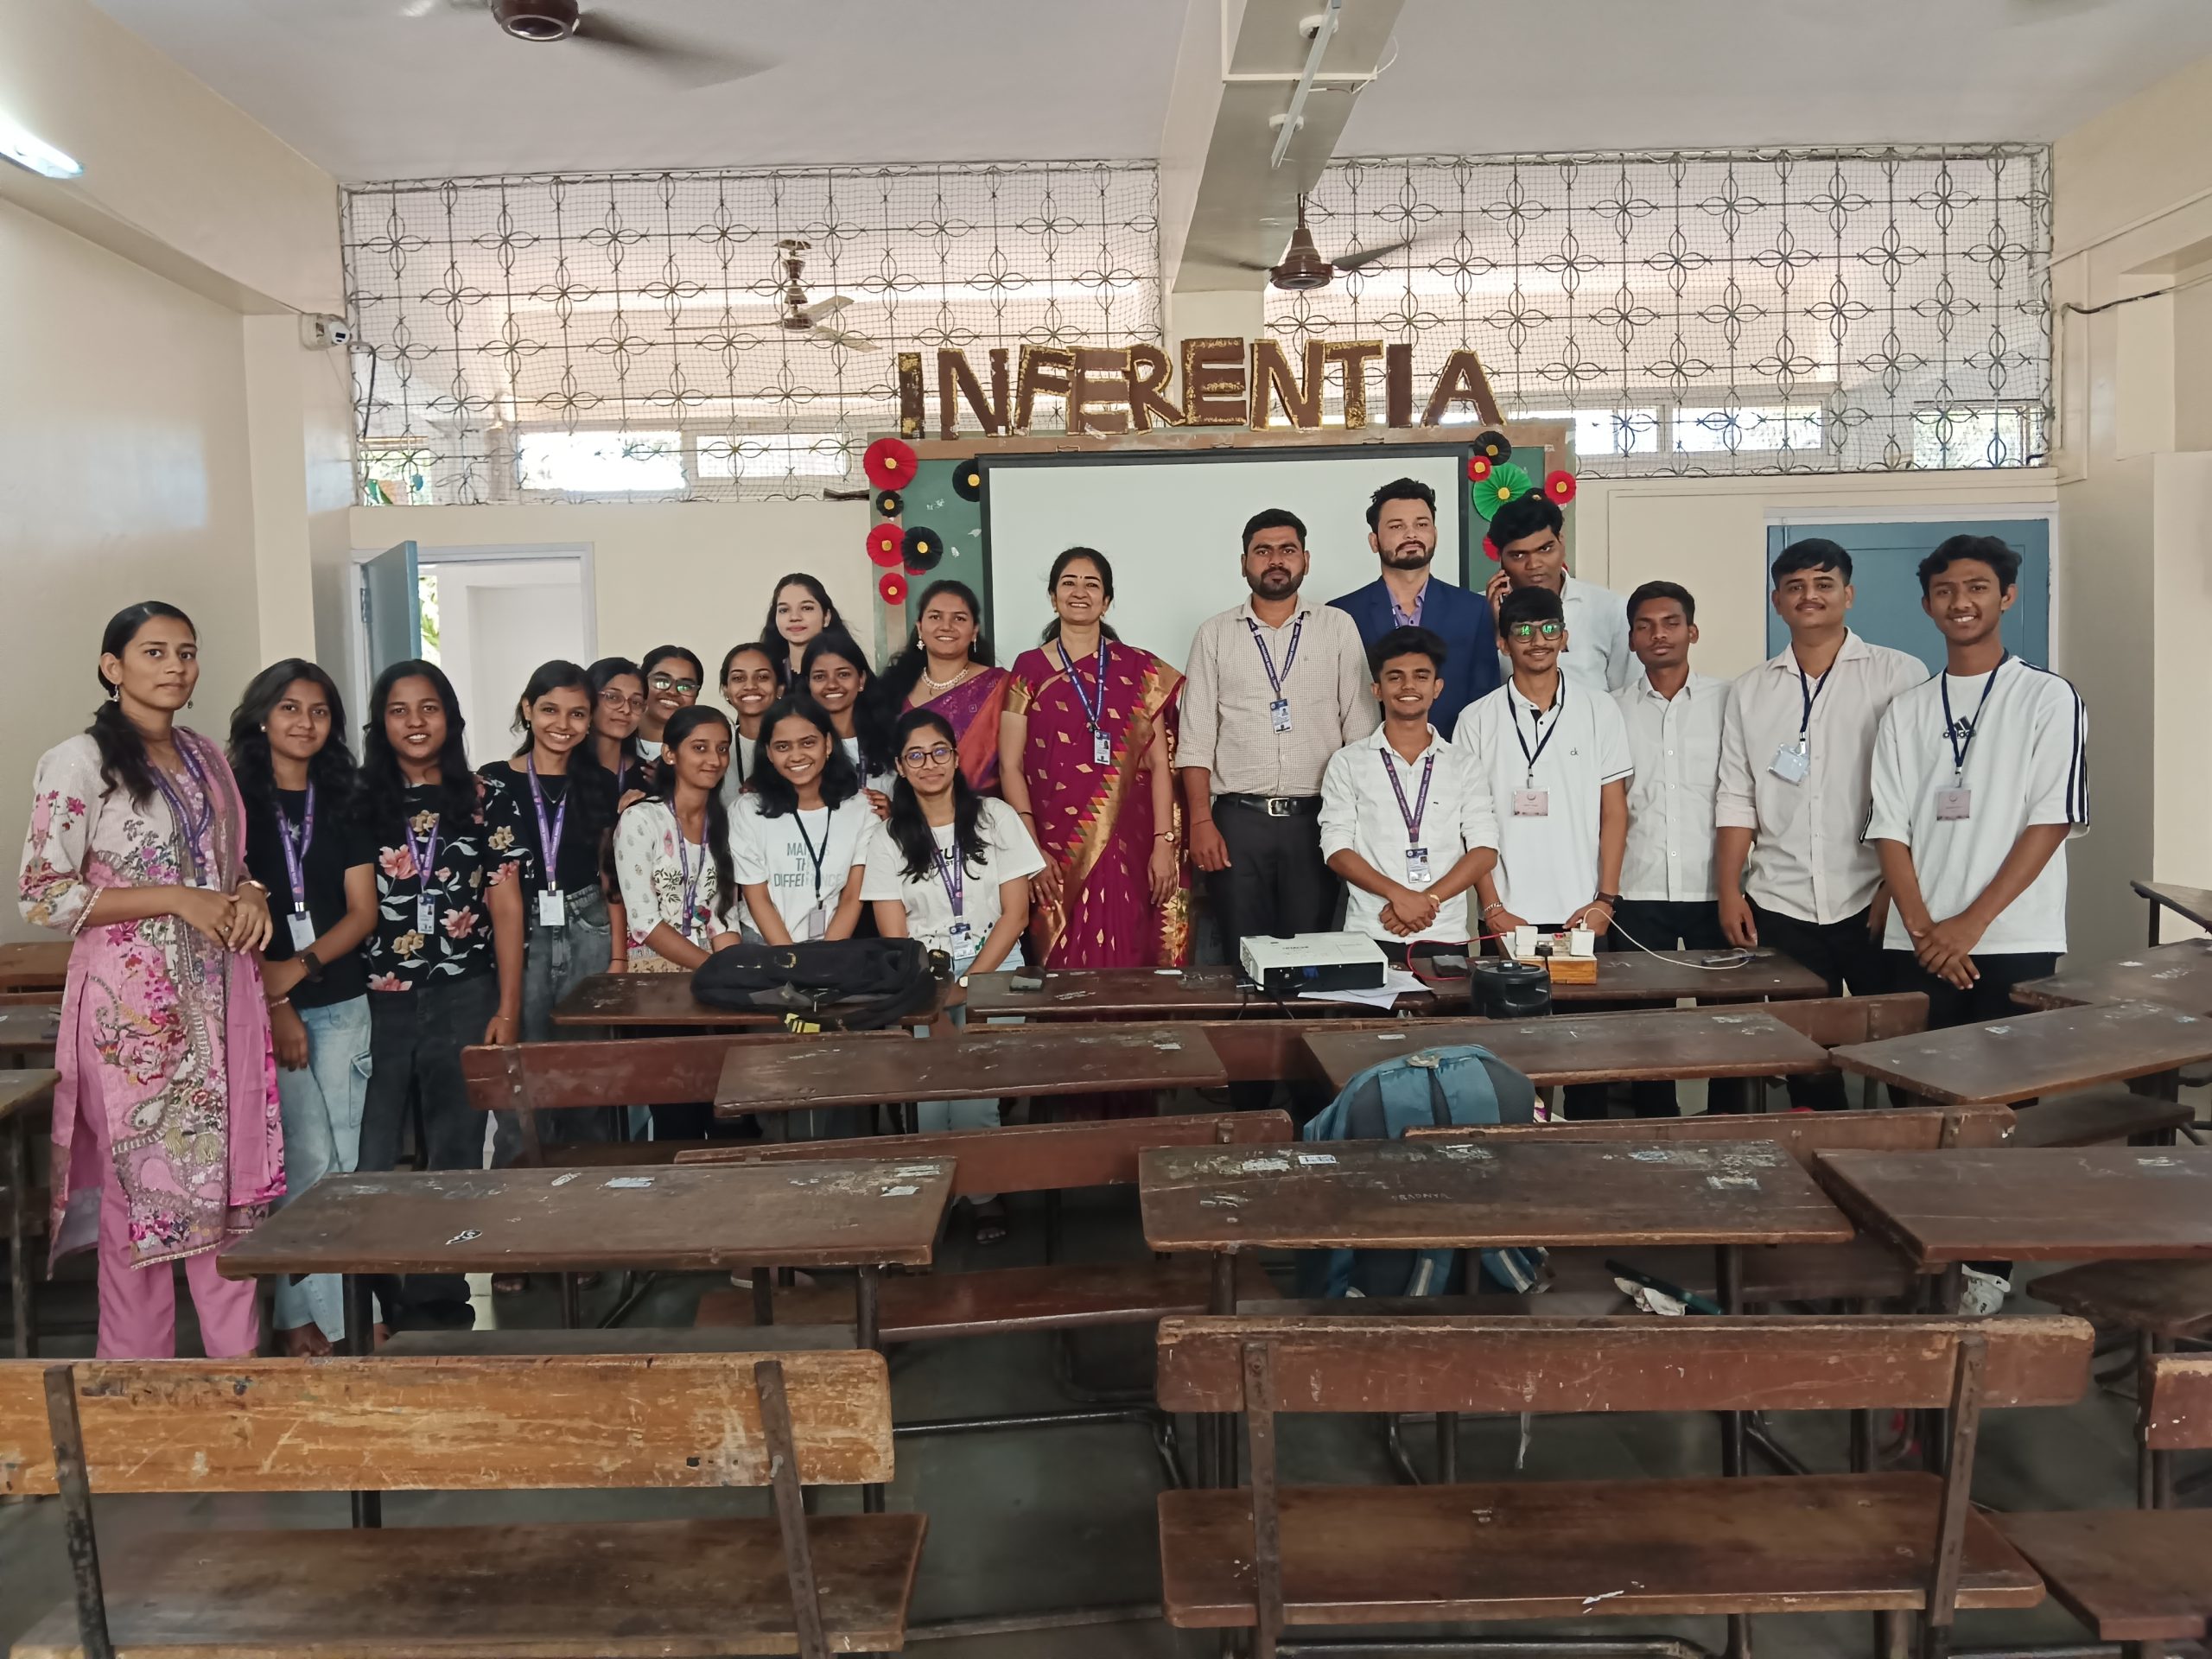
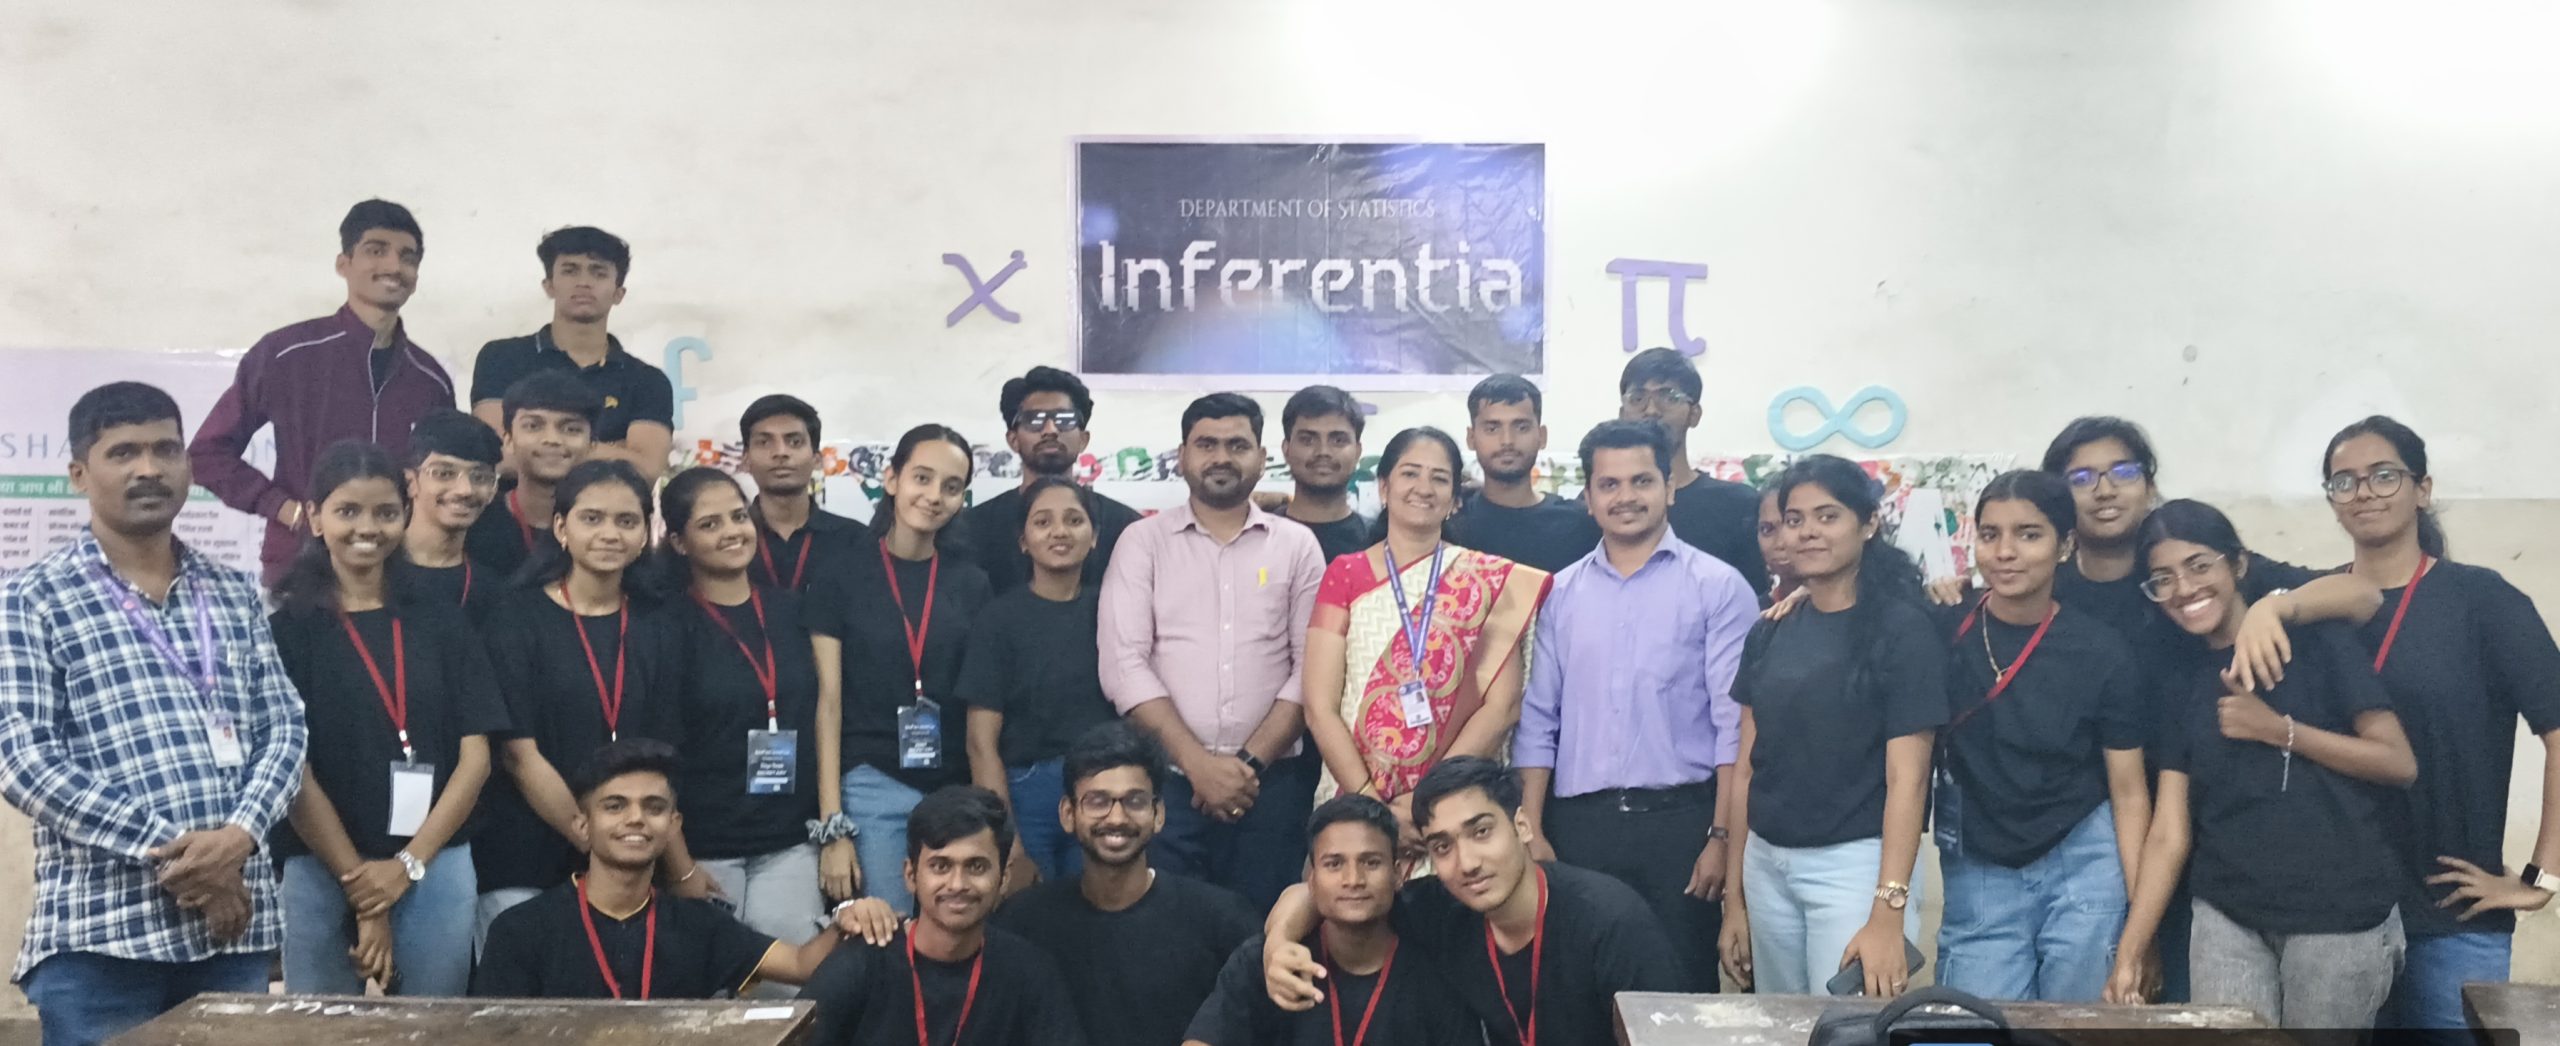
Sankhya Club is an academic initiative of the Department of Statistics at Vidya Prasarak Mandal’s B. N. Bandodkar College of Science (Autonomous), Thane (W). The club aims to promote interest in statistics and develop analytical and data-handling skills among students beyond the classroom.
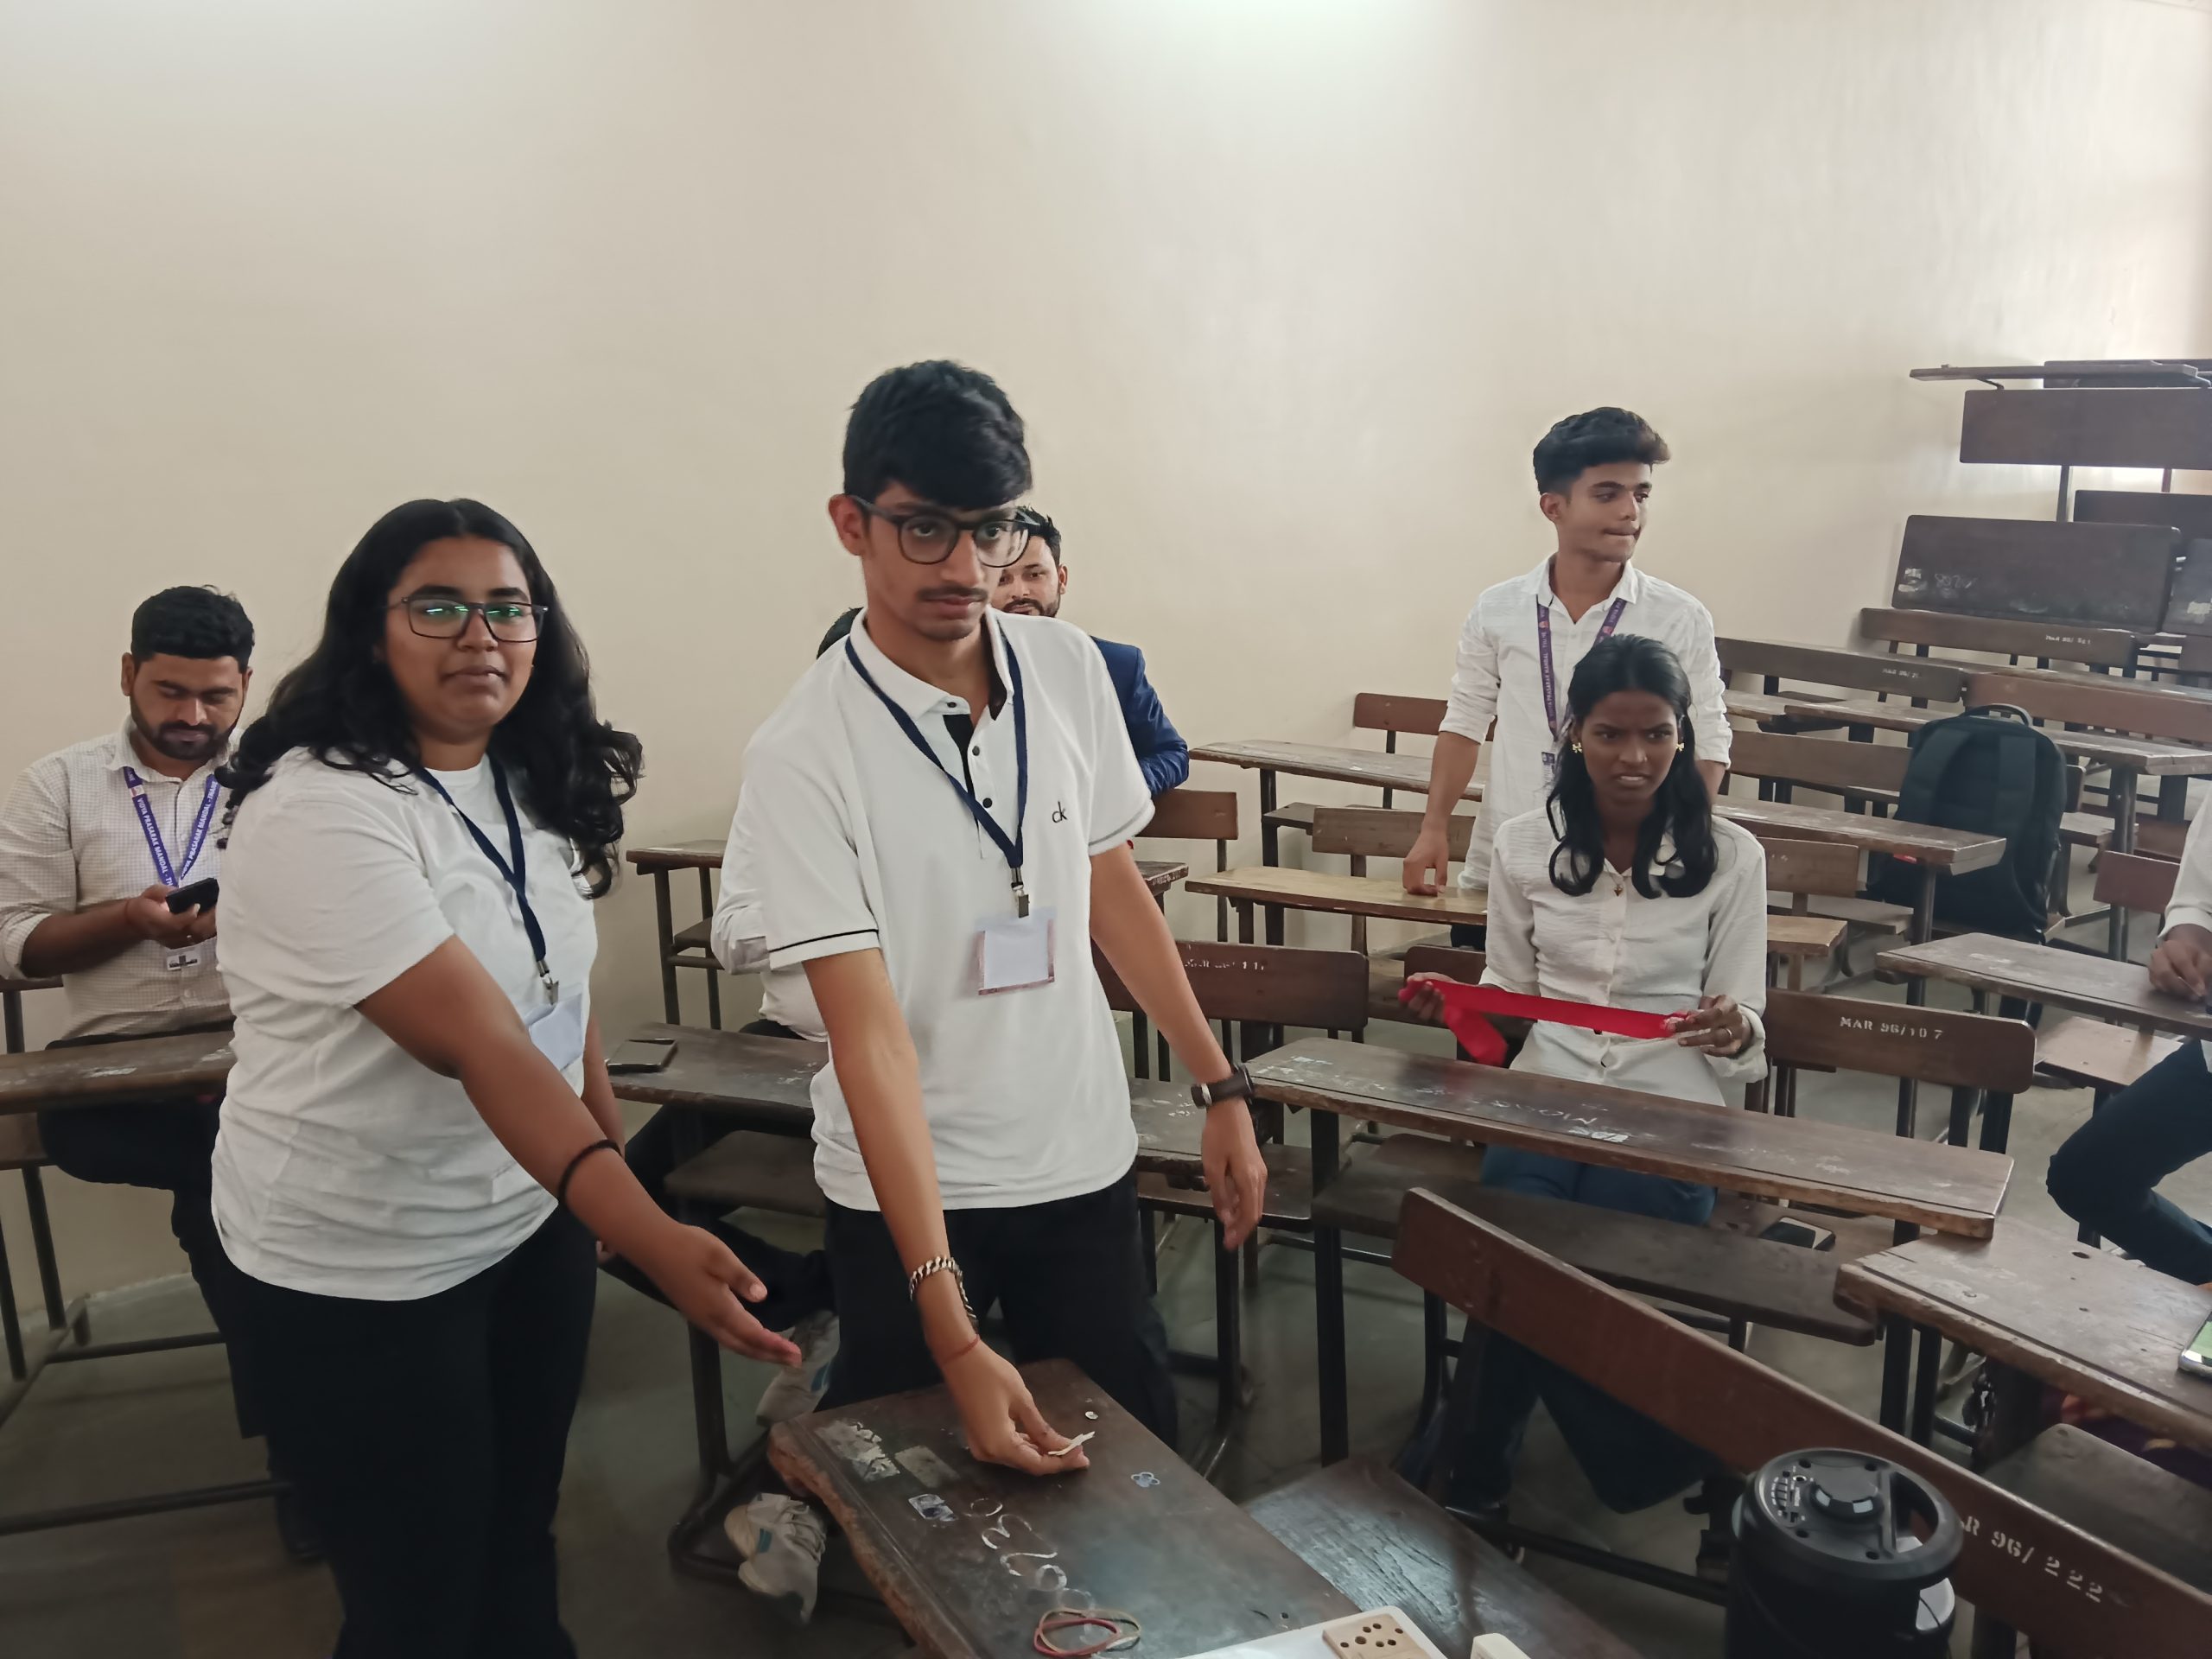
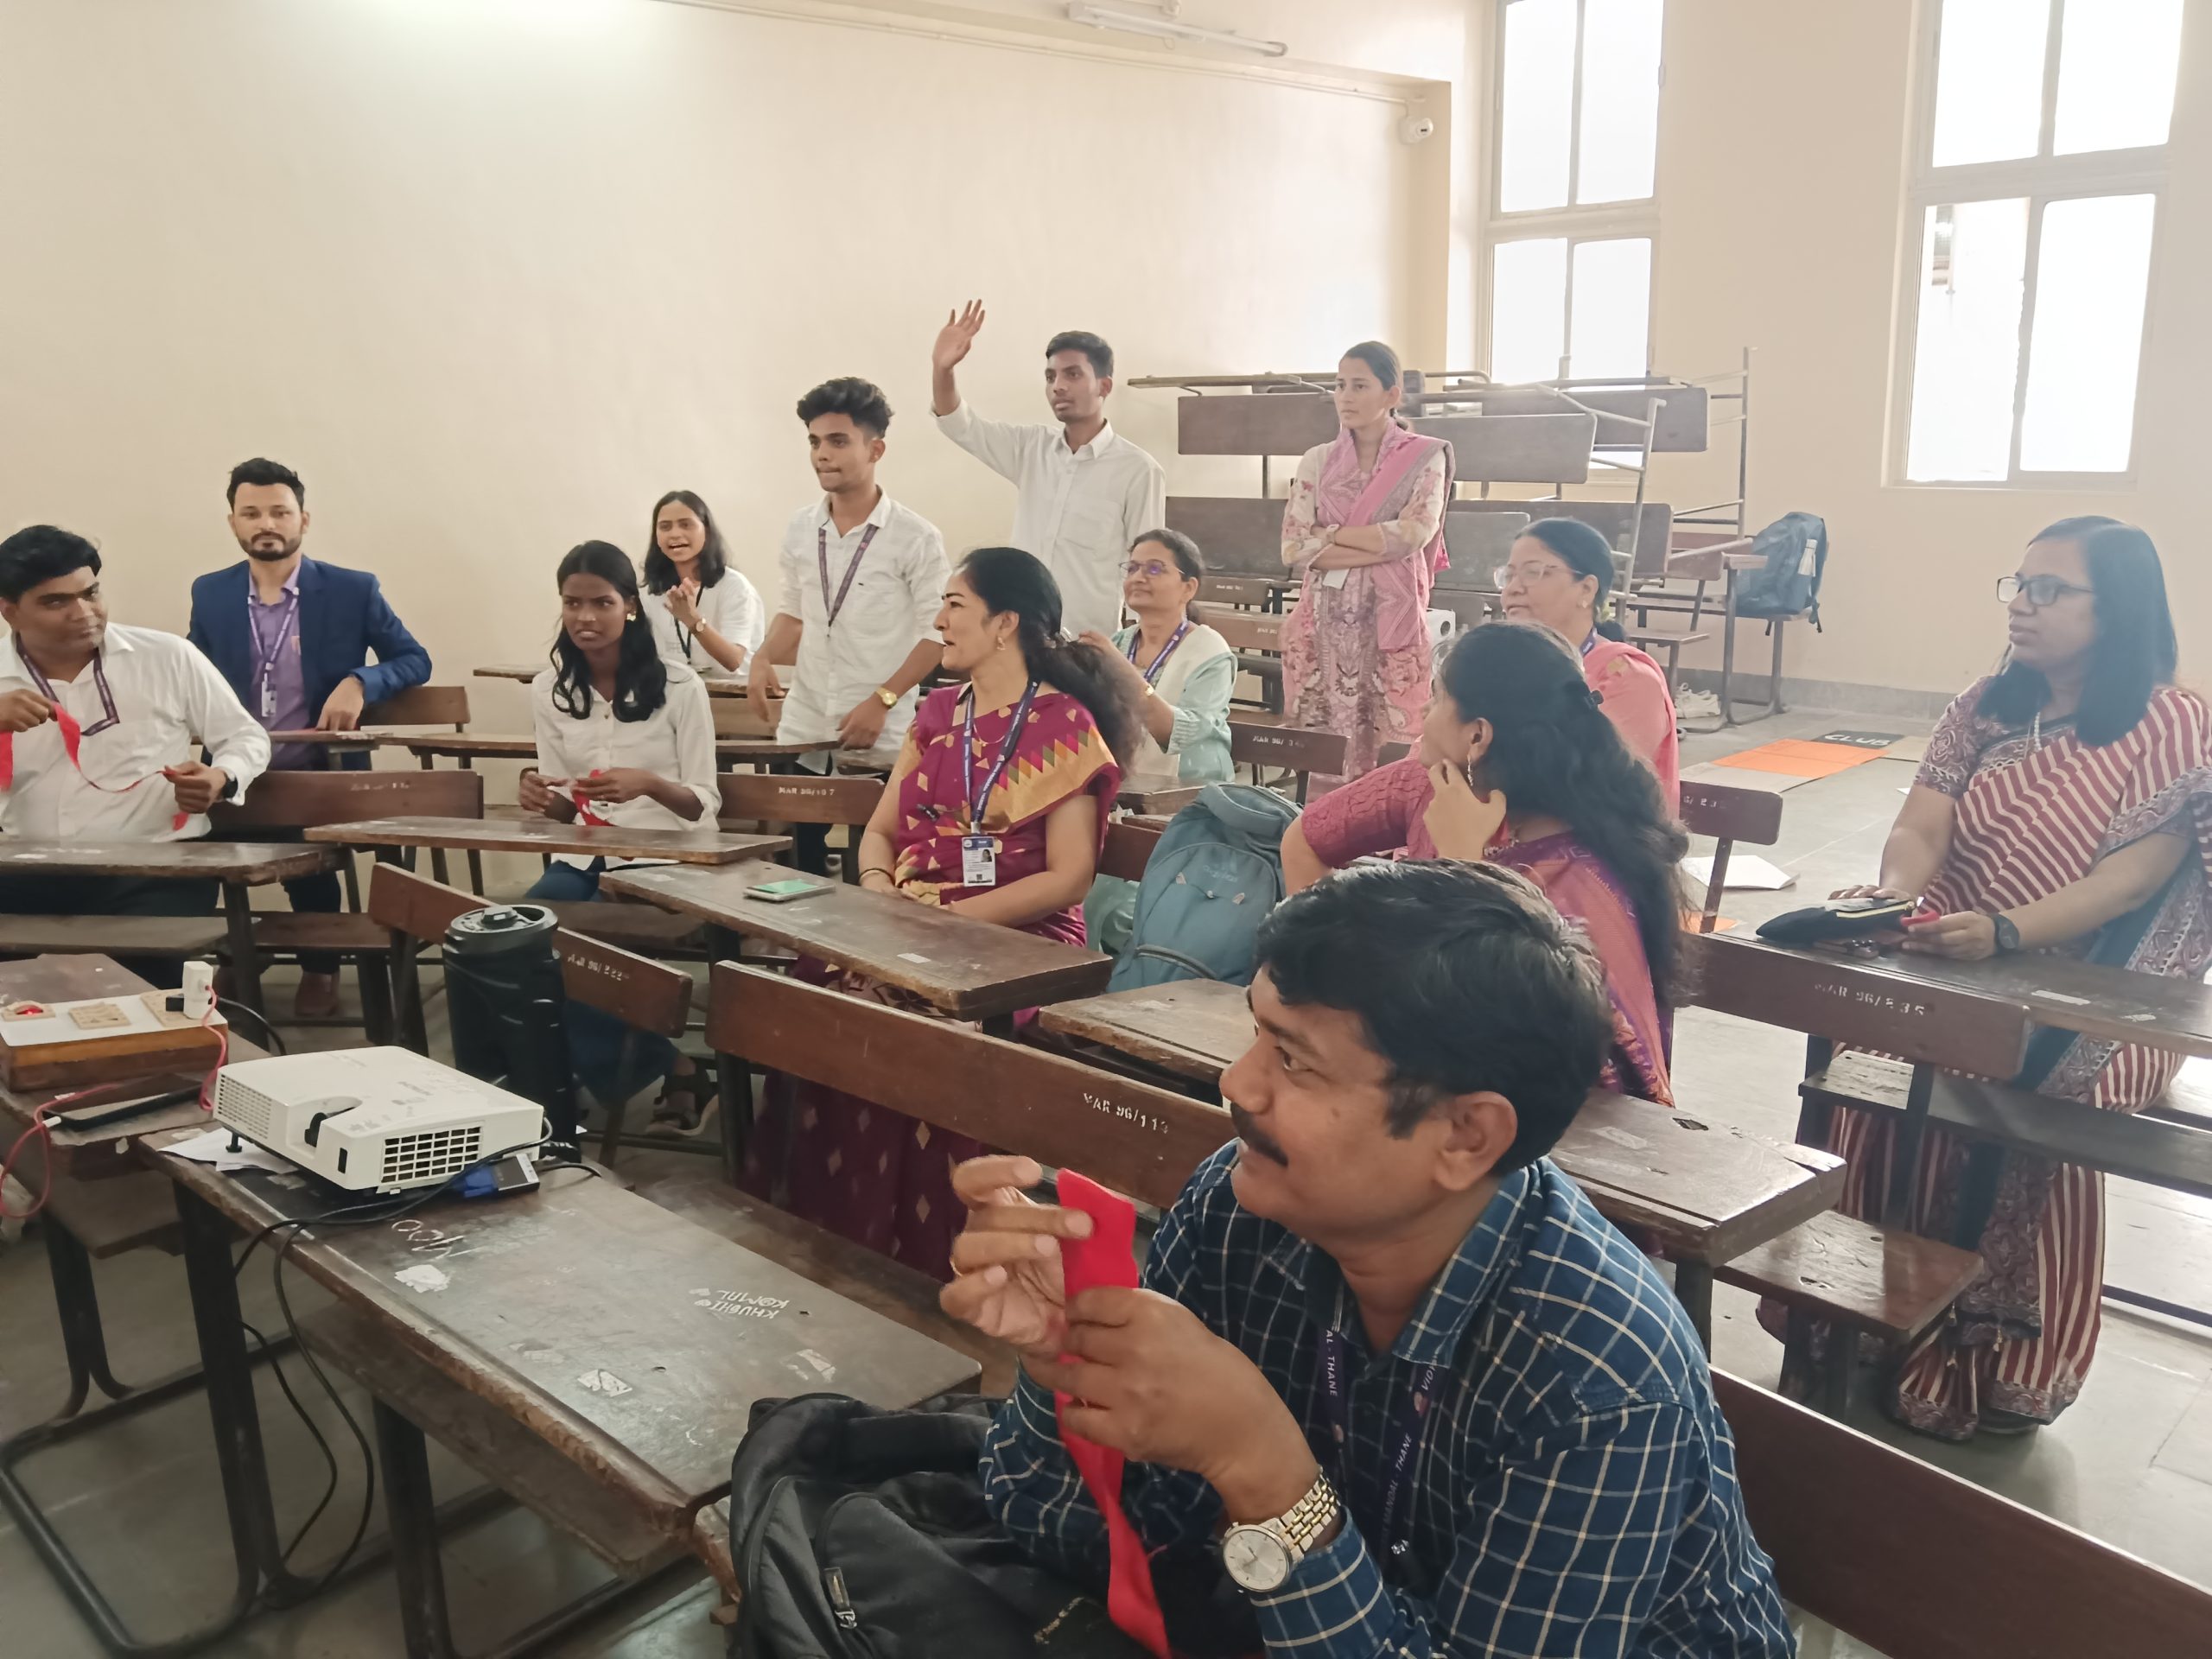
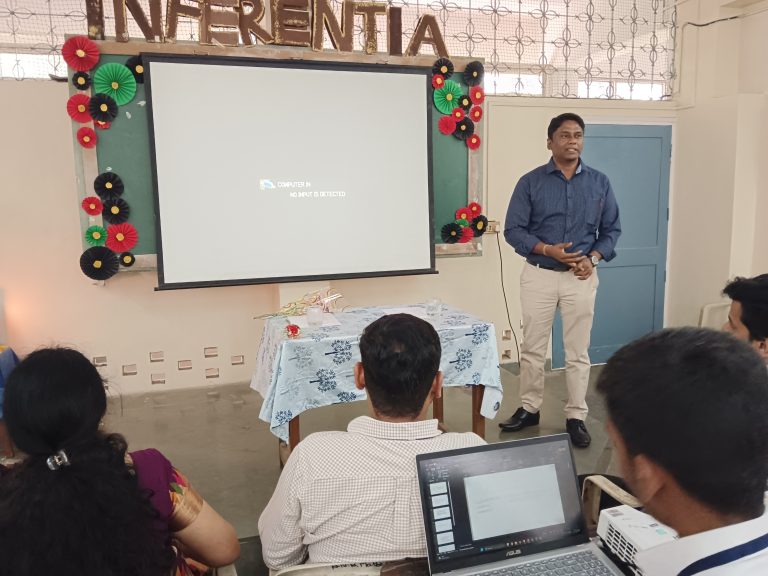
The club organizes academic and skill-based activities such as guest lectures, workshops, hands-on training in statistical software (R, Python, Excel), quizzes, poster and paper presentations, and data analysis competitions. A major highlight of the club is its annual departmental fest “Inferentia”, which provides a competitive and interactive platform for students through statistical games, quizzes, problem-solving events, and intercollegiate participation.
Through these initiatives, Sankhya Club encourages research aptitude, teamwork, leadership, and real-world application of statistical concepts, contributing significantly to students’ academic enrichment and professional preparedness.
| Sr. No. | NameDesignation | Designation |
| 1 | Mohini Kulkarni | Coordinator |
| 2 | Dr. Tukaram Navghare | Member |
| 3 | Abhishek Bandivadekar | Member |
| # | Student Constitition | |
| 1 | Aditya Padwalkar | Secretary |
| 2 | Rohit Bhor | Joint-Secretary |
| 3 | Harshada Salve | Joint-Secretary |
| 4 | Smit Joshi | Member |
| 5 | Sneha Jadhav | Member |
| 6 | Ankita Shinde | Member |
| 7 | Nupoor Deshmukh | Member |
| 8 | Shiuli Biswas | Member |